Districts
BKK1 vs BKK2 vs BKK3: An Investor's Breakdown
How three Boeung Keng Kang sangkats differ on walkability, tenants, yield and resale demand, and which investor each one actually rewards.
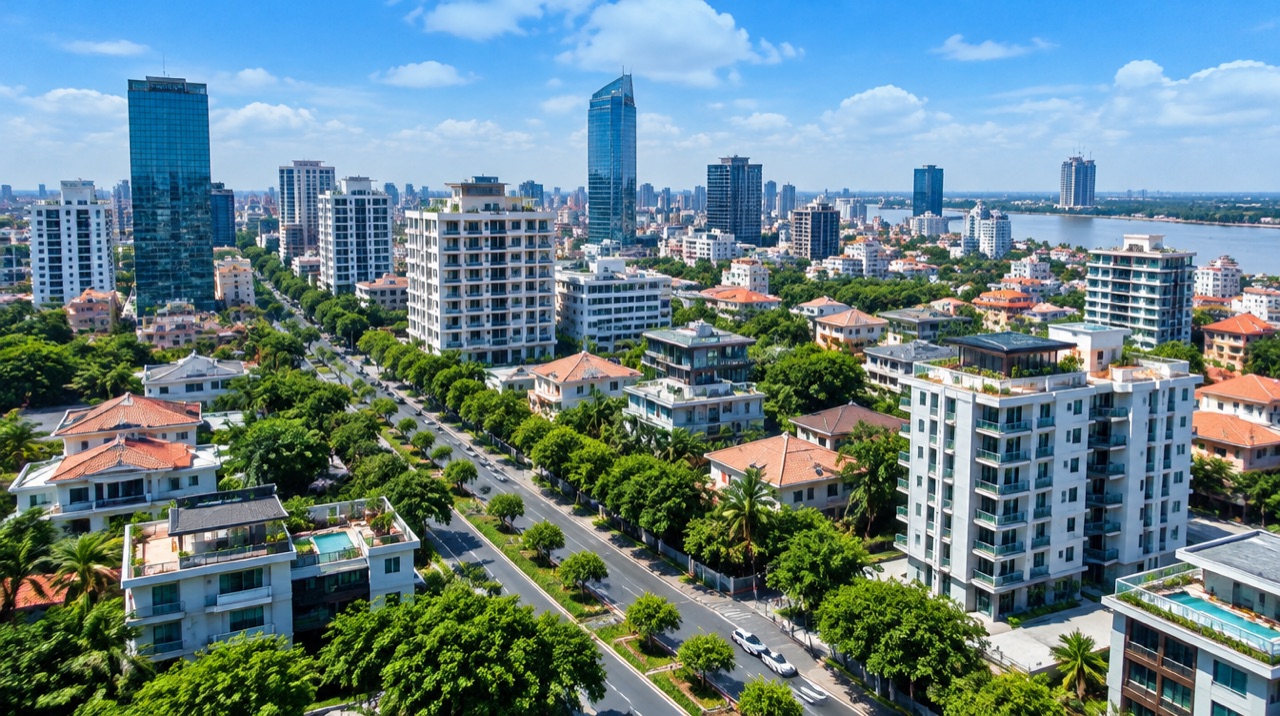
BKK1, BKK2 and BKK3 are three sangkats inside one district, Boeung Keng Kang, in central Phnom Penh. They sit within a five-minute tuk-tuk ride of each other and share the same schools, the same commercial spine and the same embassy corridor, yet they can trade at price gaps that run 30 to 50 percent across that short distance. For a resale buyer, the gap matters less than what sits behind it. Price per square metre is the input. Tenant quality, lease length, turnover, walkability and resale depth are the outputs, and that is where the three genuinely diverge.
BKK1: the stability premium
BKK1 trades at the upper end of central Phnom Penh, with gross rental yields commonly in the 6 to 8 percent range and net yields lower after management, vacancy and costs. The premium does not show up in the yield line. It buys the tenant and it buys the walk. BKK1 is the one sangkat here where daily life happens on foot, with groceries, clinics, cafes, co-working and embassies inside a walkable radius. That is why diplomats, NGO staff and corporate executives on housing budgets choose it, why leases run long and voids stay short. The structural constraint is street capacity, as narrow roads and rising car ownership make parking the real pressure. For resale, BKK1 offers the deepest and most internationally visible buyer pool of the three.
BKK2: the quieter, local hold
BKK2 sits in Chamkarmon and looks central on a map, though not on foot. It has upgraded steadily over the years, with cleaner streets and better housing stock, without pushing its price ceiling up to BKK1 levels. Residents mostly drive or take a tuk-tuk for daily errands, and that trade of walkability for more space and a lower monthly cost shapes the tenant mix: affluent local families, mid-level corporate staff, and longer-term residents. The stock leans toward Khmer townhouses, boreys and smaller blocks rather than condo towers, so it rarely features in city-wide oversupply analysis. Resale is less liquid, because the buyer pool is narrower and less internationally visible, but the entry point is lower and the income is stable.
BKK3: the yield case, with conditions
BKK3 shows the highest gross yields in the district and the lowest square-metre pricing, sometimes close to half of BKK1. The conditions behind those numbers matter. Living in BKK3 is a driving experience, not a walking one, which caps what landlords can charge, and rents have compressed materially since the speculation phase. Management quality across the smaller buildings varies, with no dominant operator running to a consistent standard, a real cost for an owner who cannot be on the ground. Proximity to the Tuol Sleng Genocide Museum also shapes a durable segment of local buyer demand. The yield case is genuine for an active owner, but the capital appreciation and resale story is weaker.
All three sit inside Cambodia's dollarised economy, so rent is collected in US dollars and the currency risk common across the region is largely absent. What separates them is the question worth answering before you look at listings: what kind of owner do you want to be? BKK1 behaves like a bond with a tenant attached, BKK2 is a slower local hold, and BKK3 is a small business that rewards hands-on management. At Invest in Phnom Penh, we walk investors through that decision, and the resale depth of each sangkat, before any shortlist is built.
Get a personal answer
Ask us anything about the Cambodian market. We answer within one business day, in English, Russian, Chinese or Spanish.
Talk to an AdvisorMarket Insights
 Strategy
Buying in a Down Market: The 2008 Lesson for Phnom Penh
Every cycle, the best entry points feel the most uncomfortable. Here is what the recovery after 2008 can teach a patient buyer looking at Phnom Penh in 2026.
 Strategy
The Patient Capital Playbook: How to Buy Through a Property Downturn
A calm, repeatable method for deploying capital in a falling market. It rests on preparation, a margin of safety, and a hold measured in years rather than months.
 Strategy
Why Cash Buyers Have the Advantage in a Soft Market
When credit tightens and confidence drains away, liquidity becomes the scarcest asset in the room. Here is how cash converts into speed, certainty, and a better price.